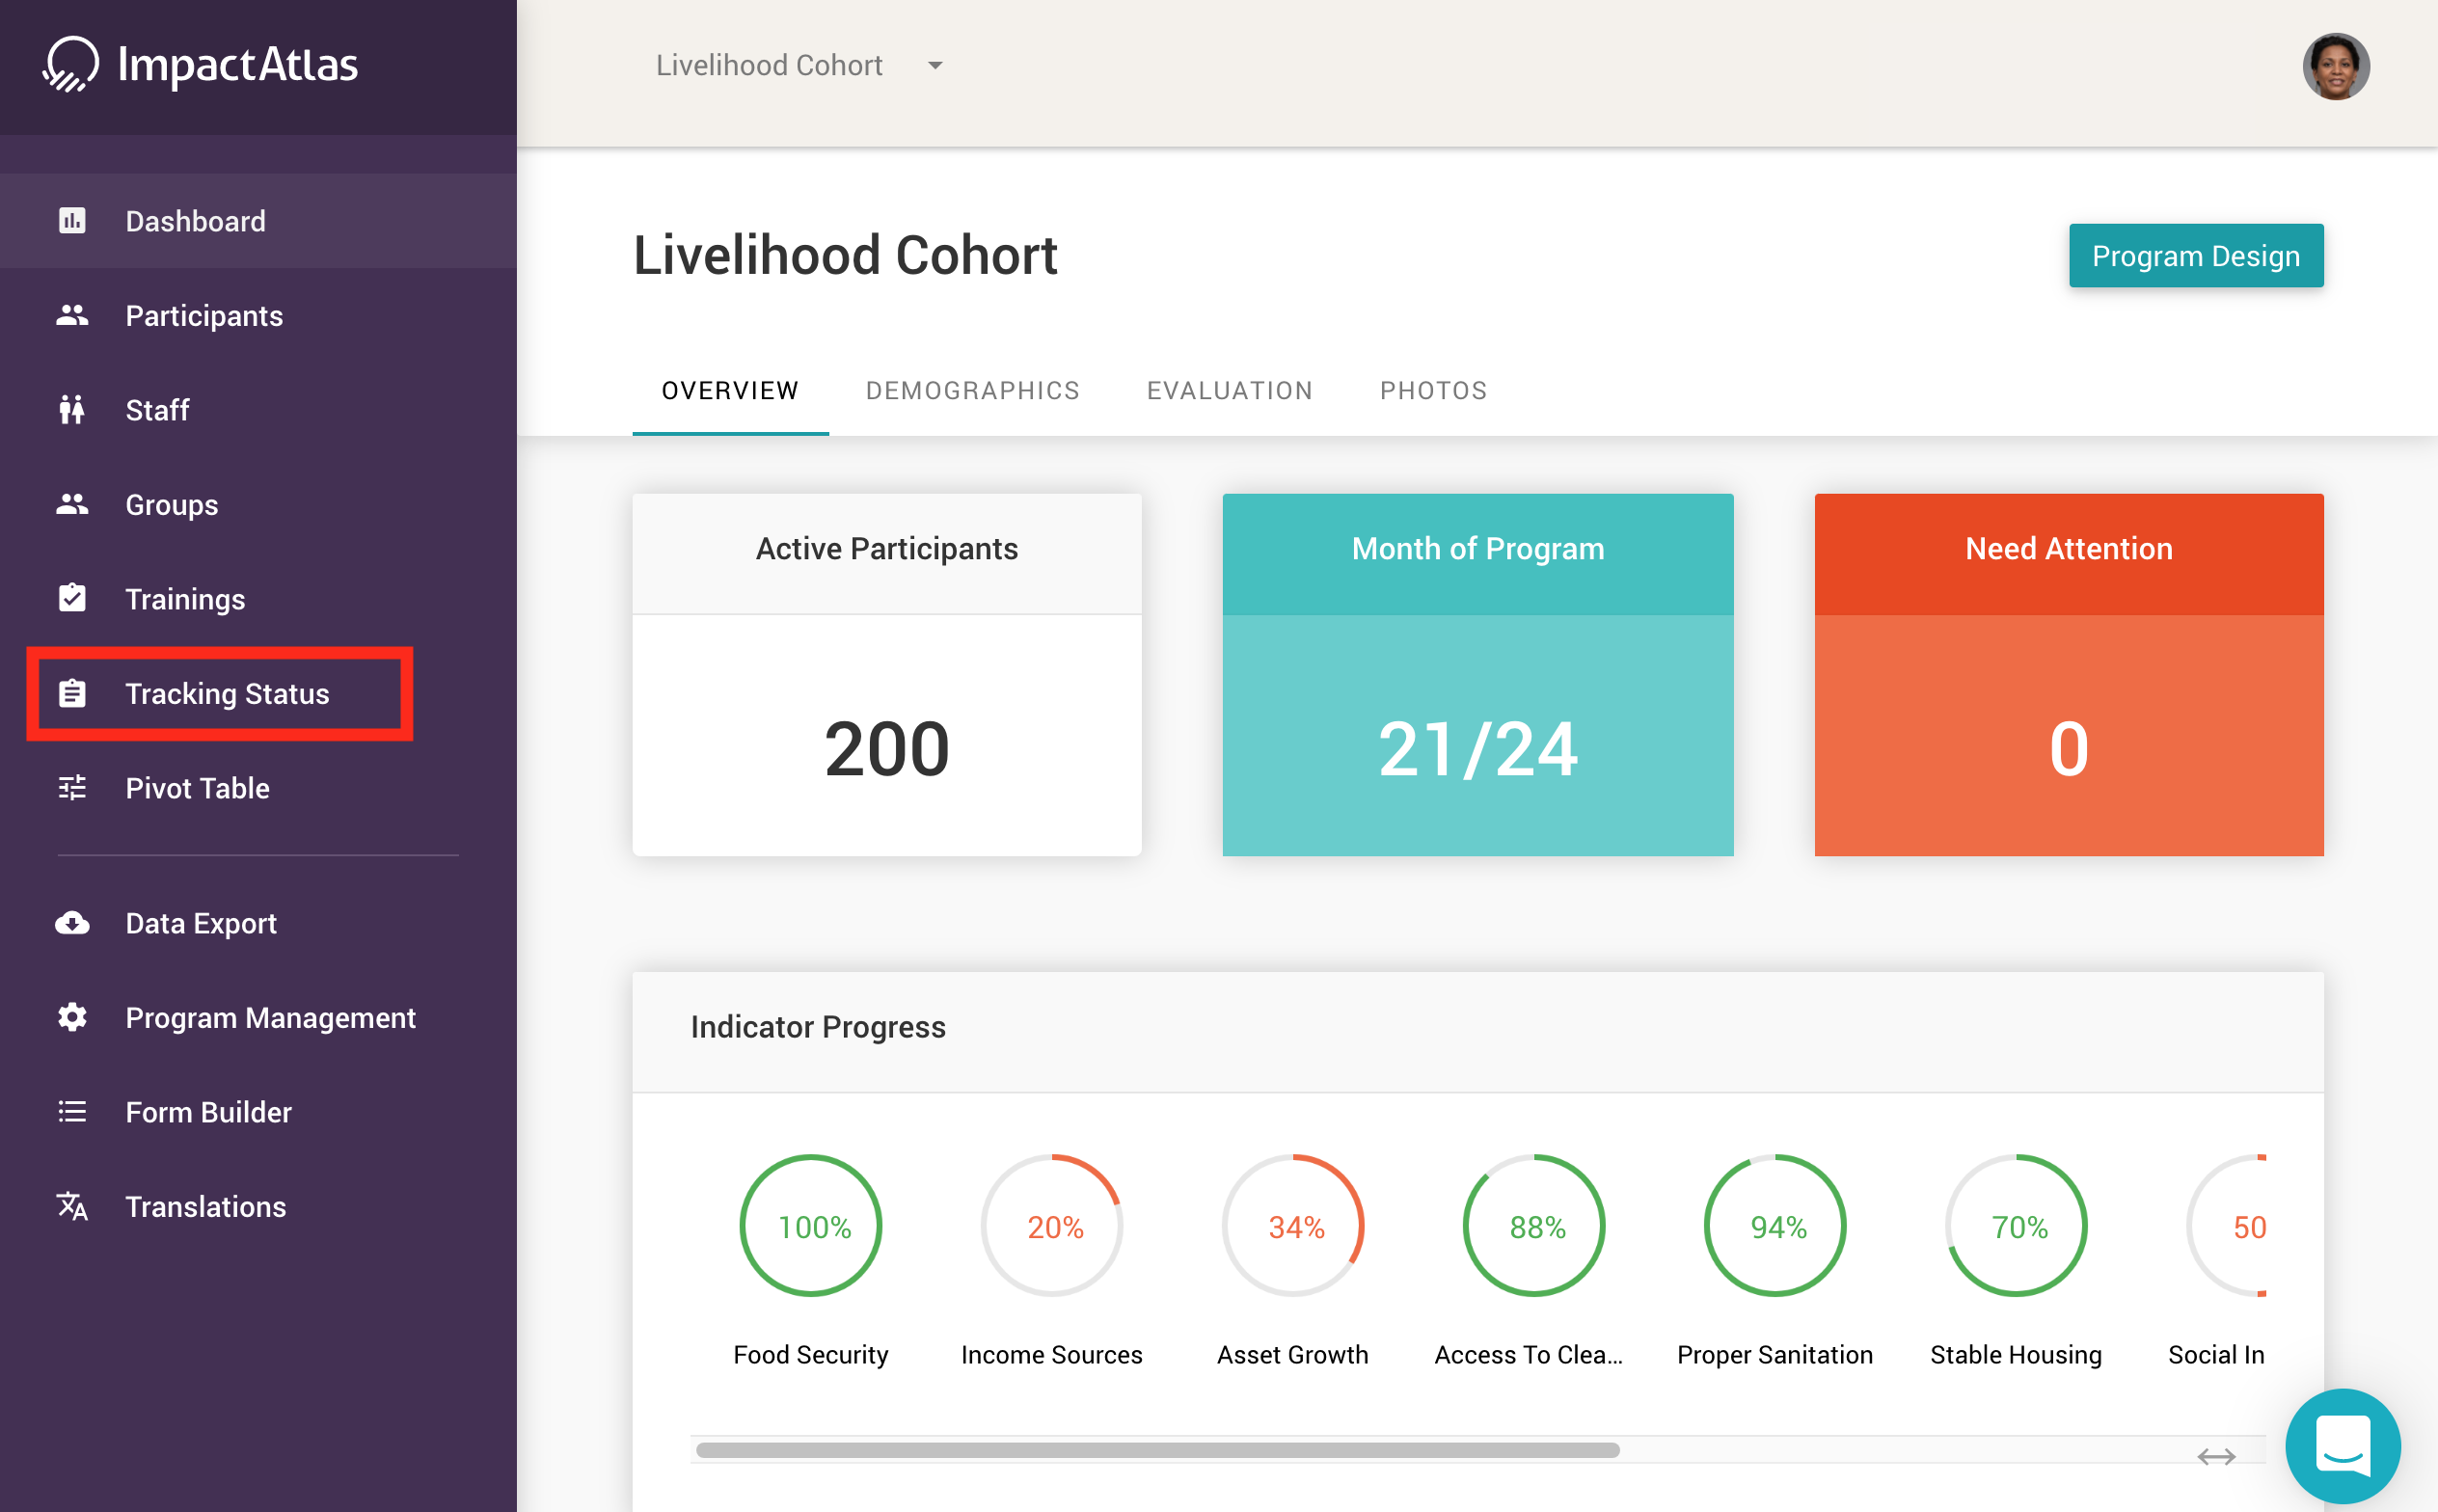
The Tracking Status widget is a great tool that lets you see all the different phases of the program based on the surveys and trainings that you have conducted.
Go to the Tracking Status widget on the lefthand navigation panel:
.png)
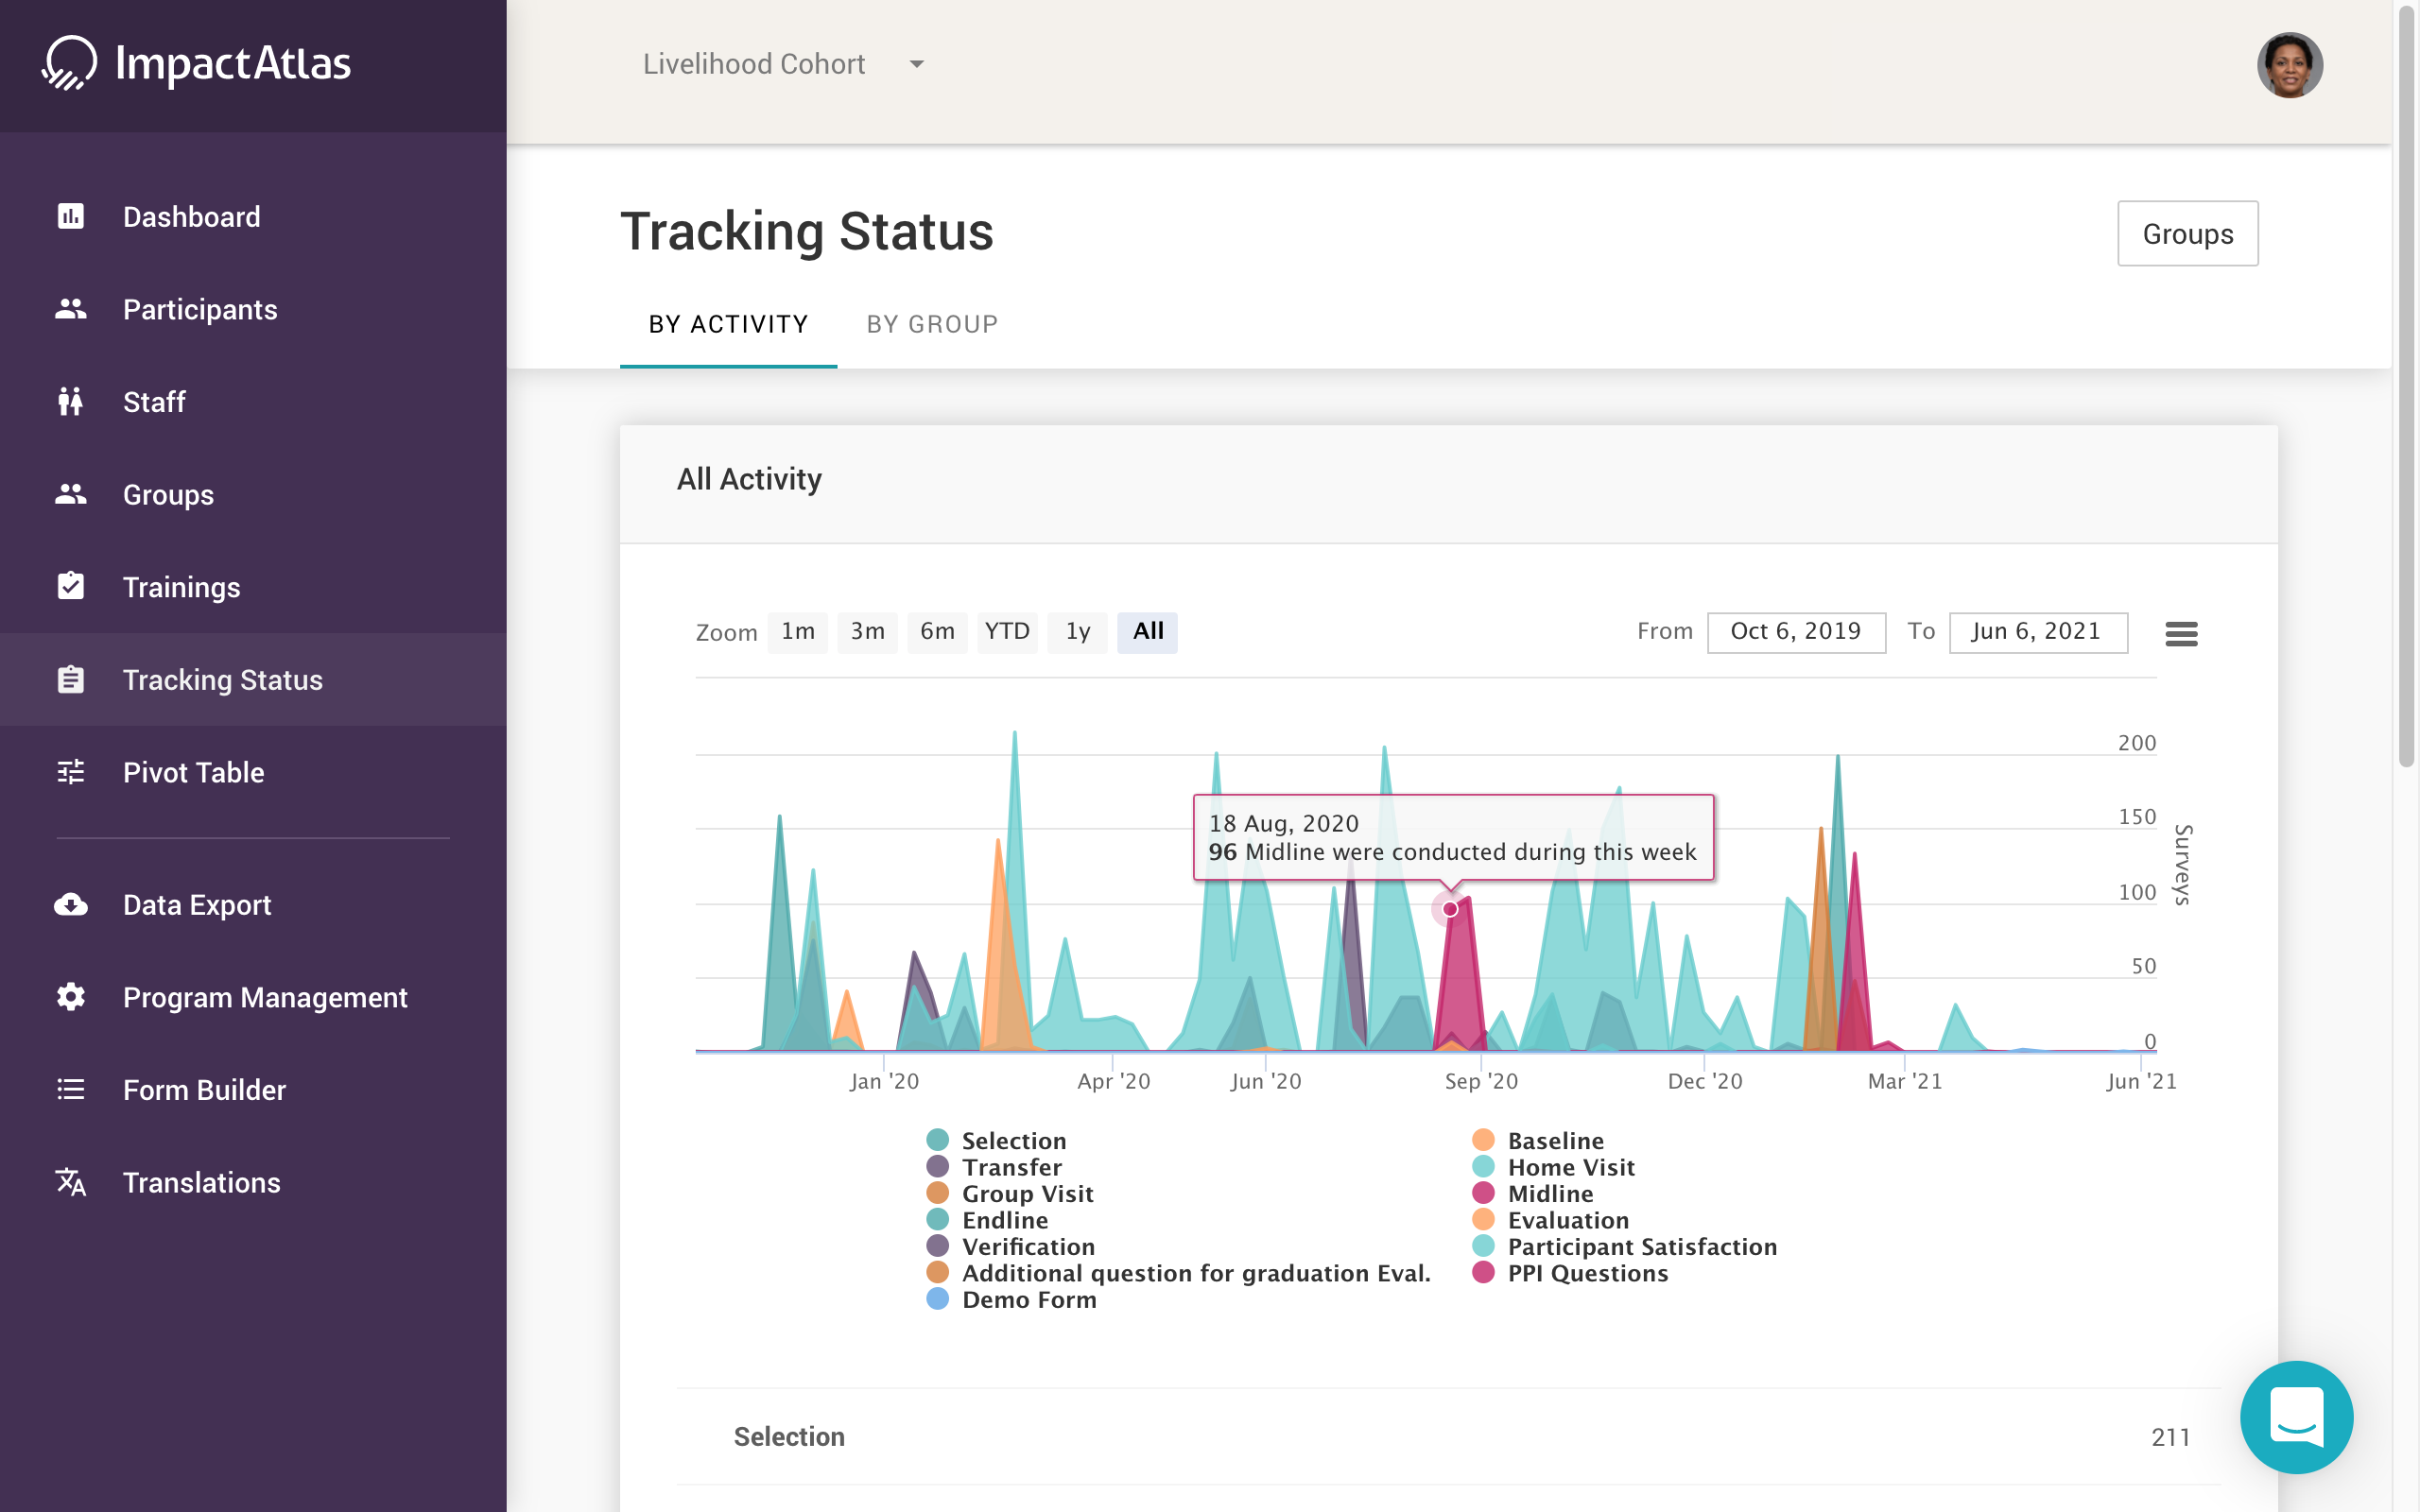
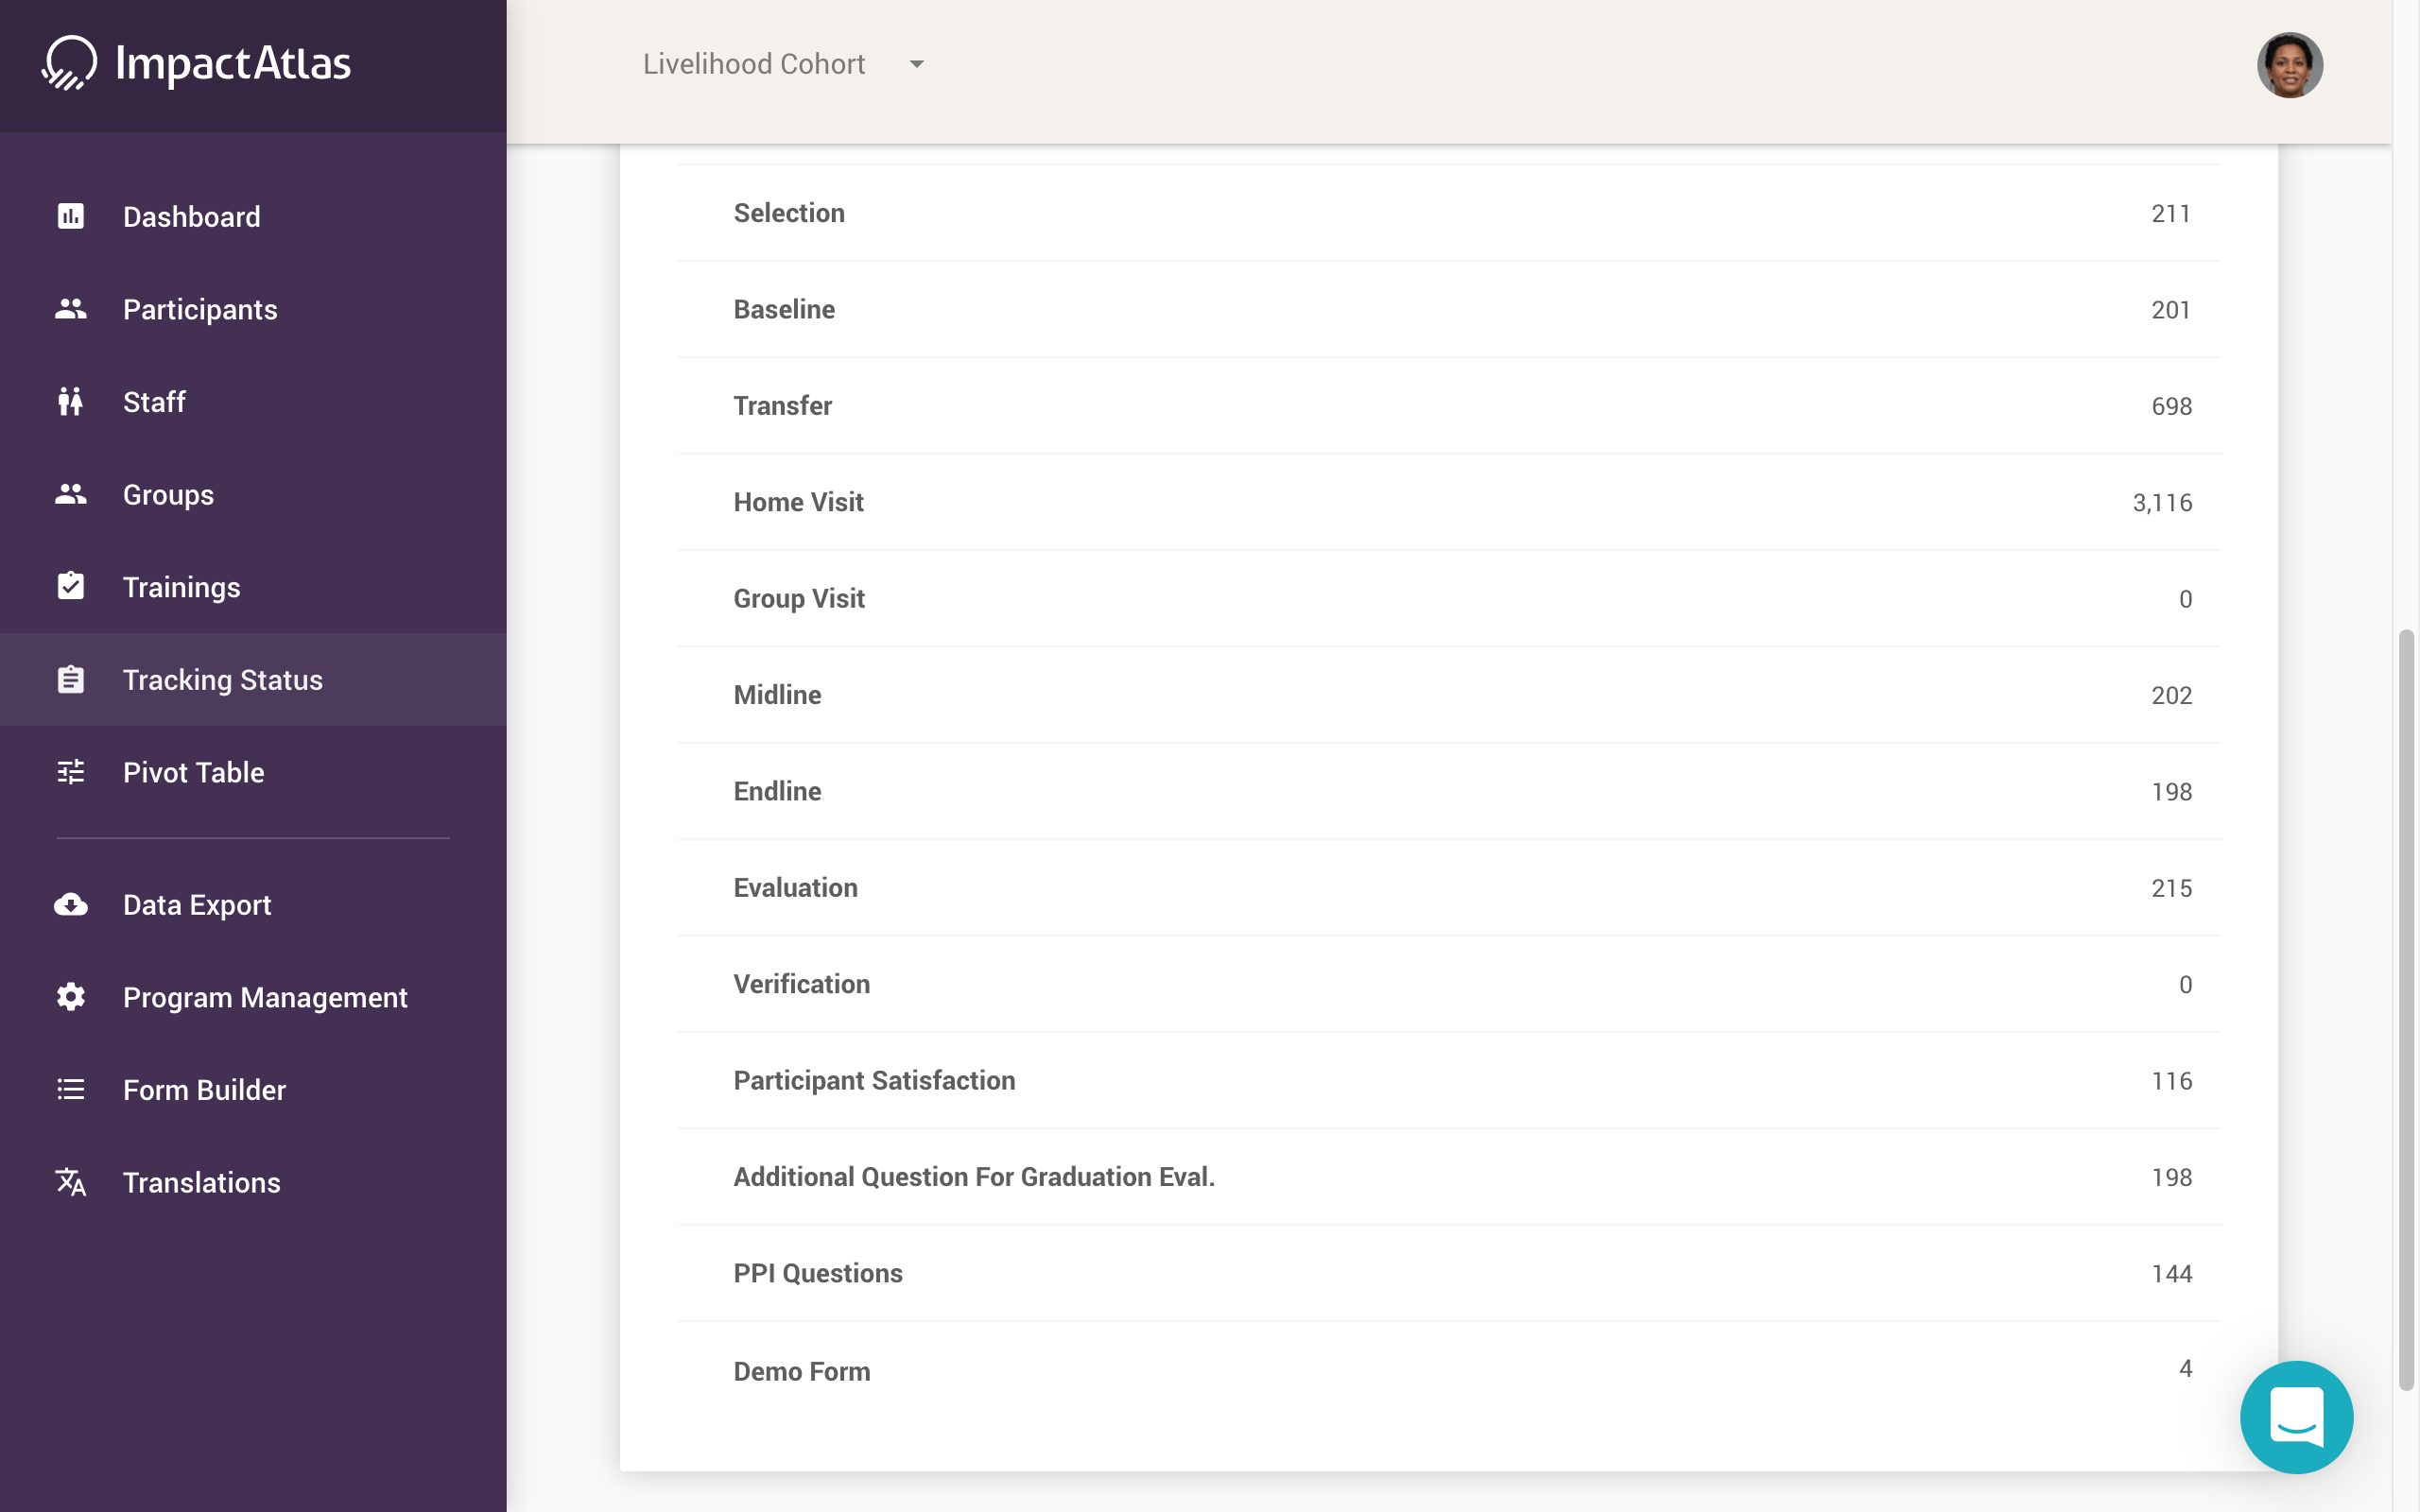
You will then see the tracking status home page where all program activity is displayed on an interactive graph on the top of the page and a list of activities completed on the bottom. The line graph displays activities undertaken in chronological order. Each color represents a training or survey that has been undertaken.
.png)
.png)
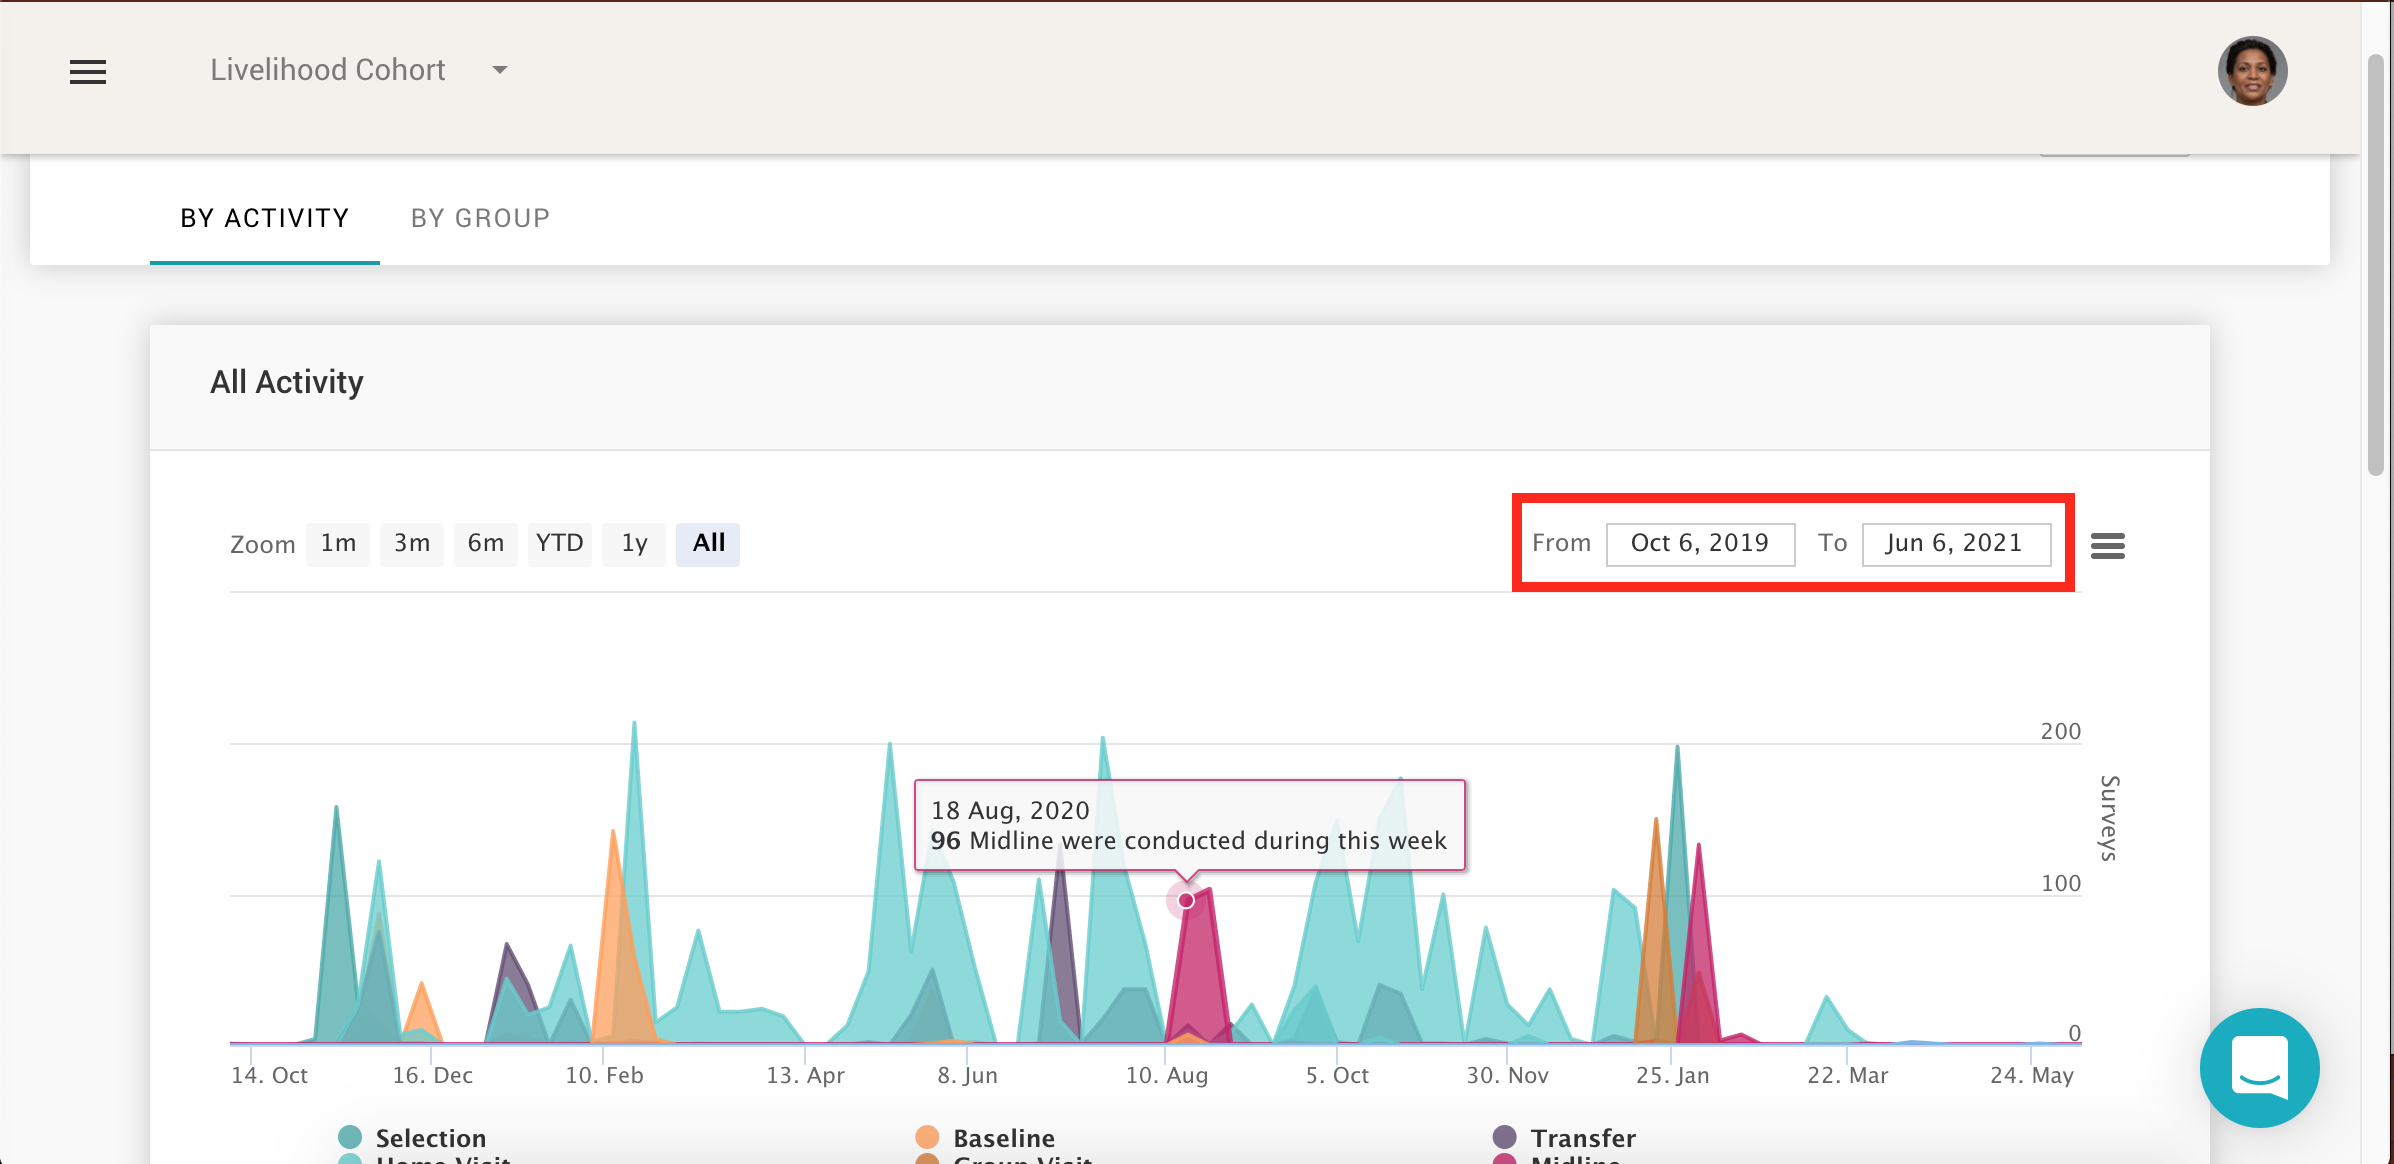
Placing your cursor on any of the different colored data on the line graph will reveal a window with data:
.png)
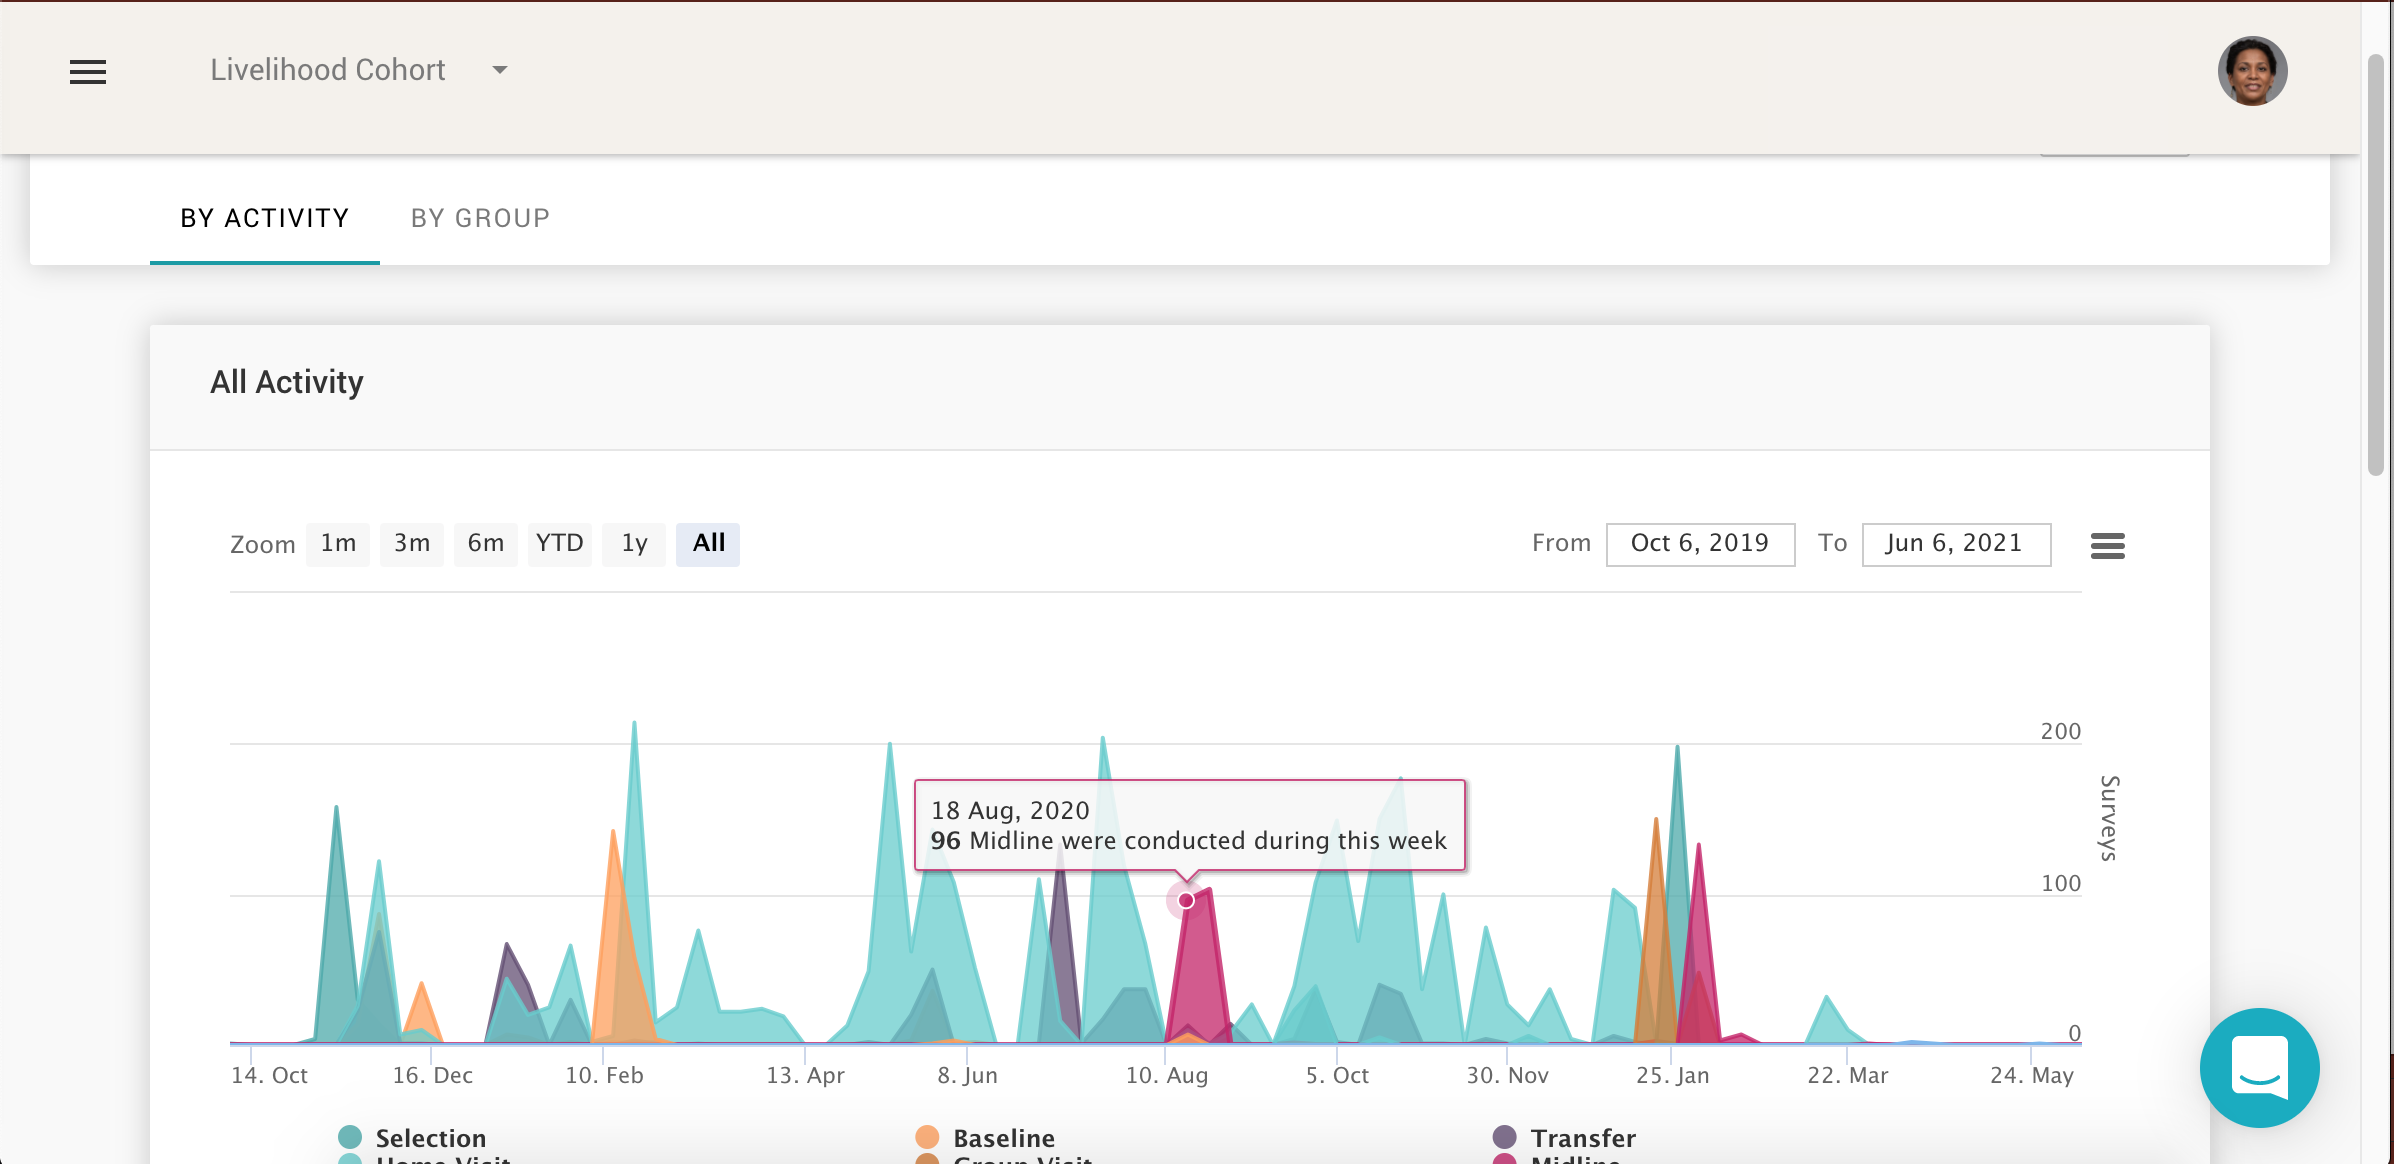
You can adjust the data that you see based on a specific date range using the date widget at the top of the graph:
.png)
Clicking the widget to the right of the dates gives you three options on how you can export the data:
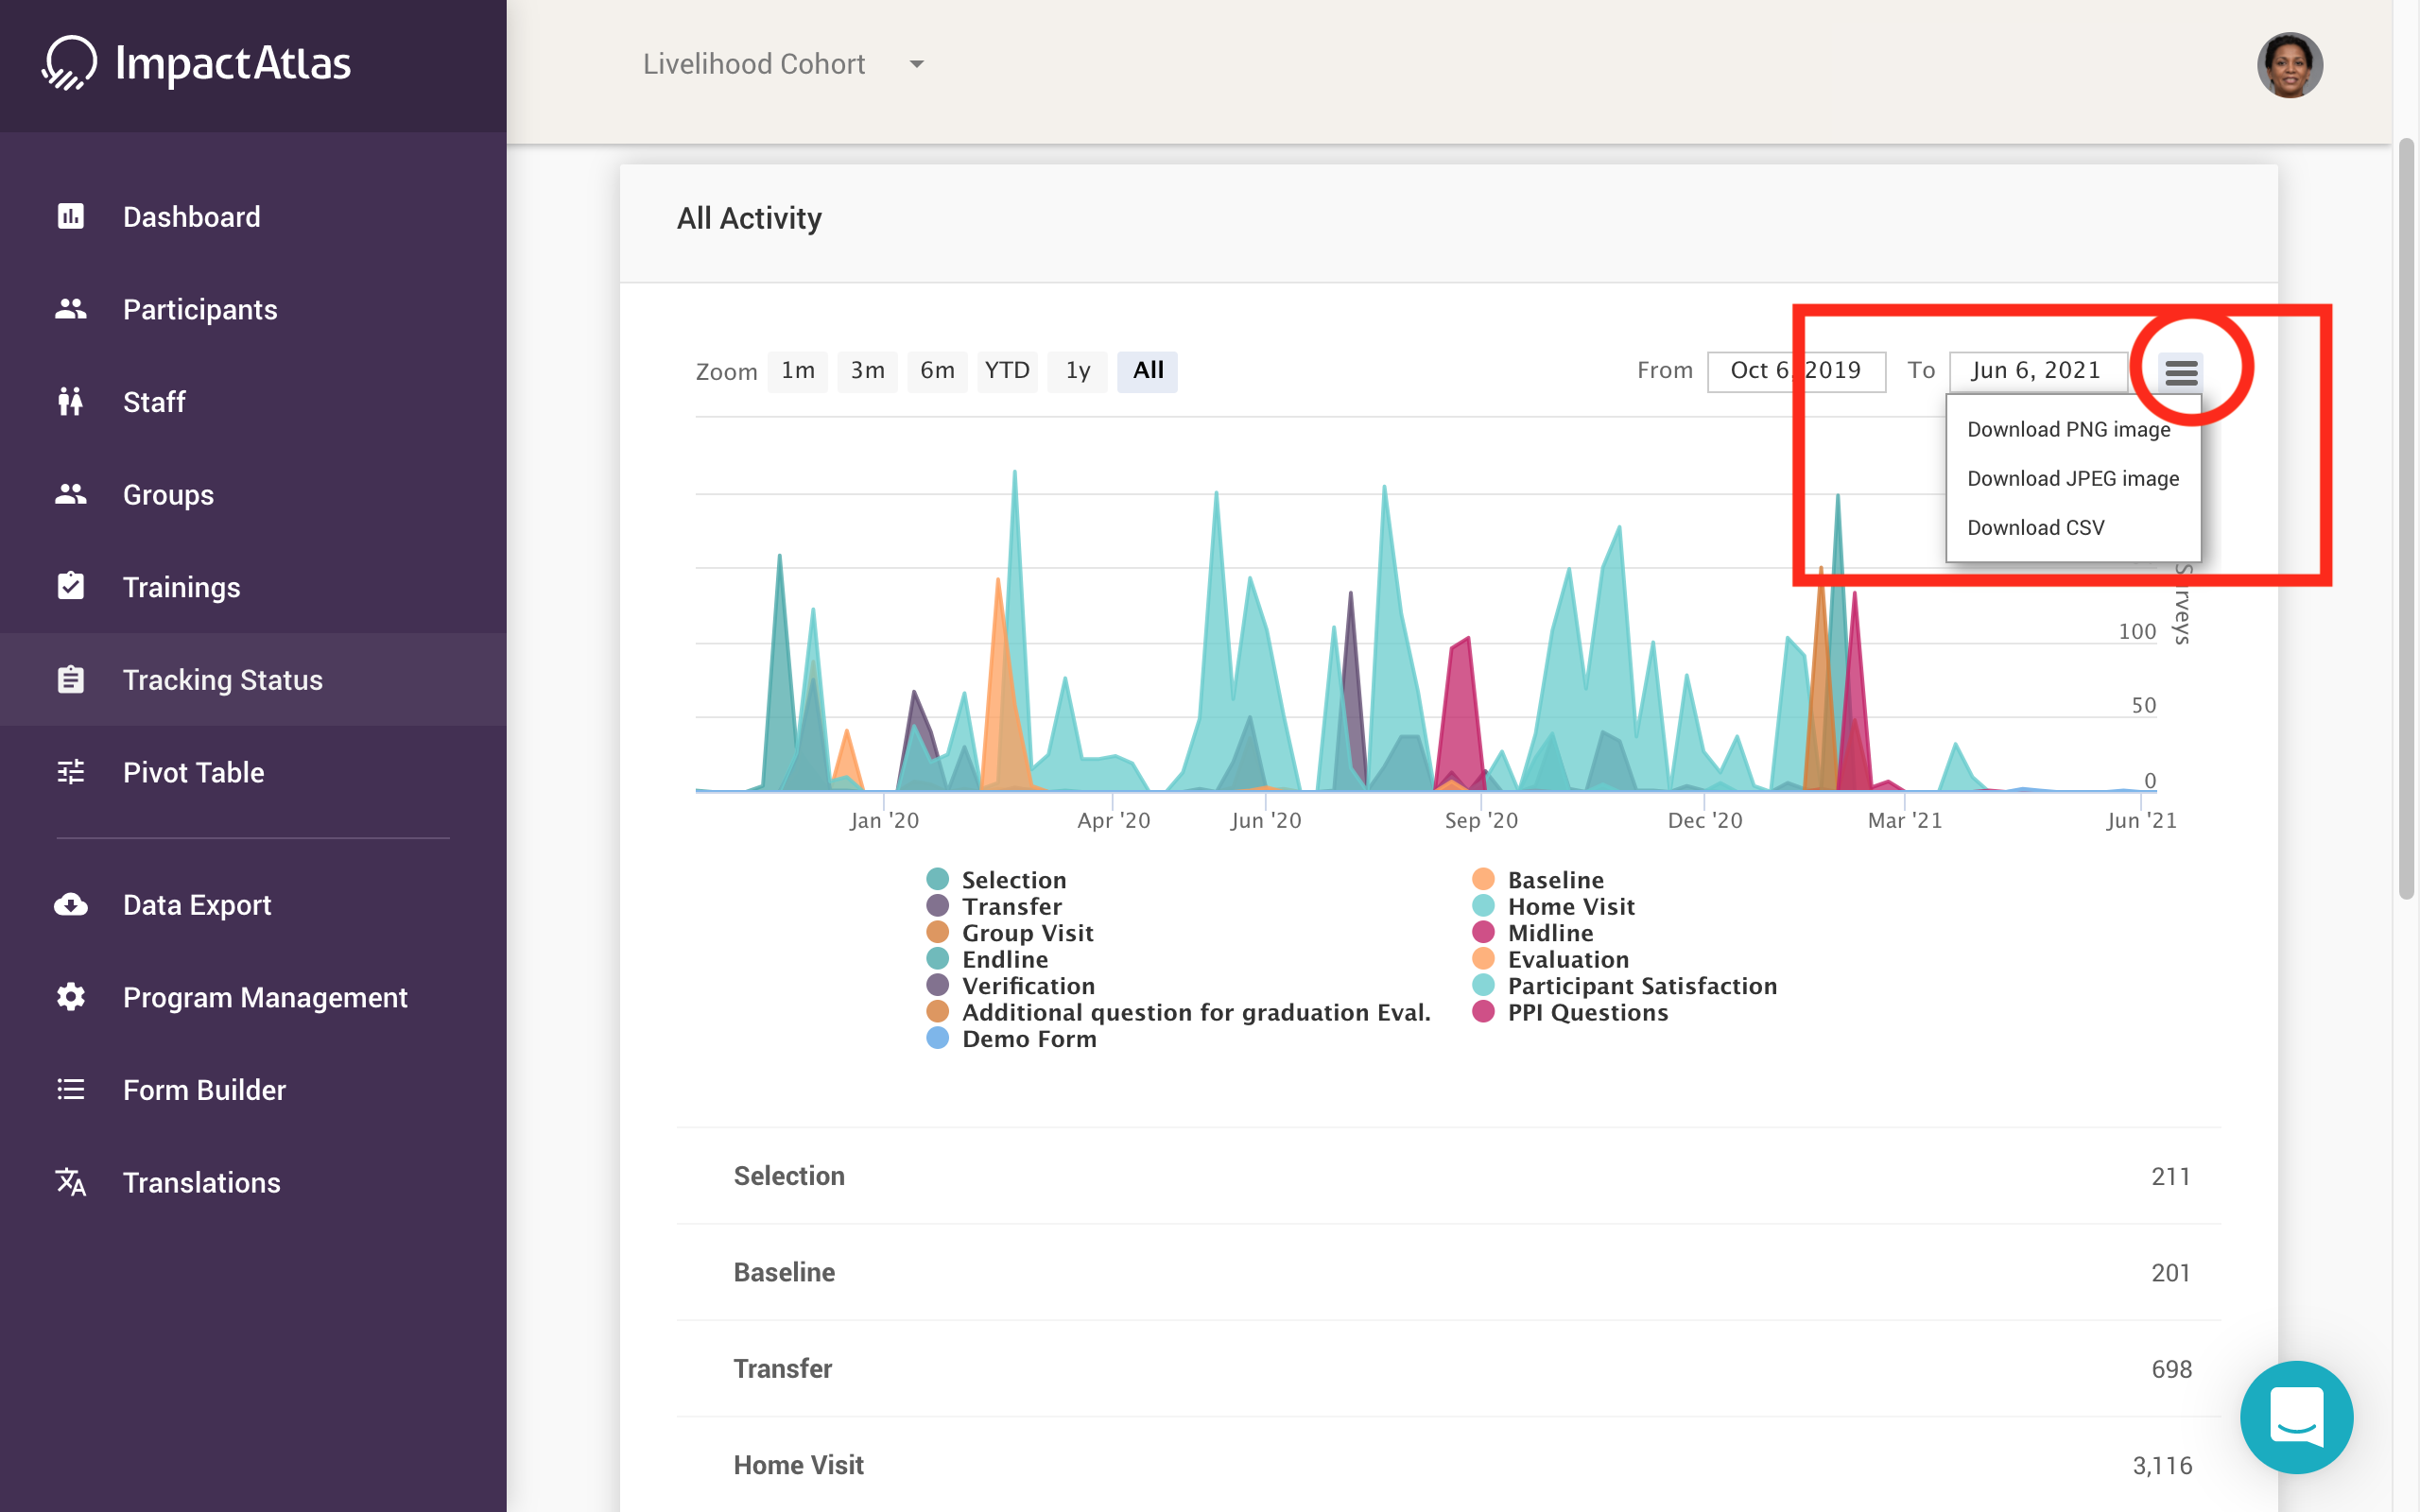.png)
The video below is a tutorial that explains how to get the most out of this tool.