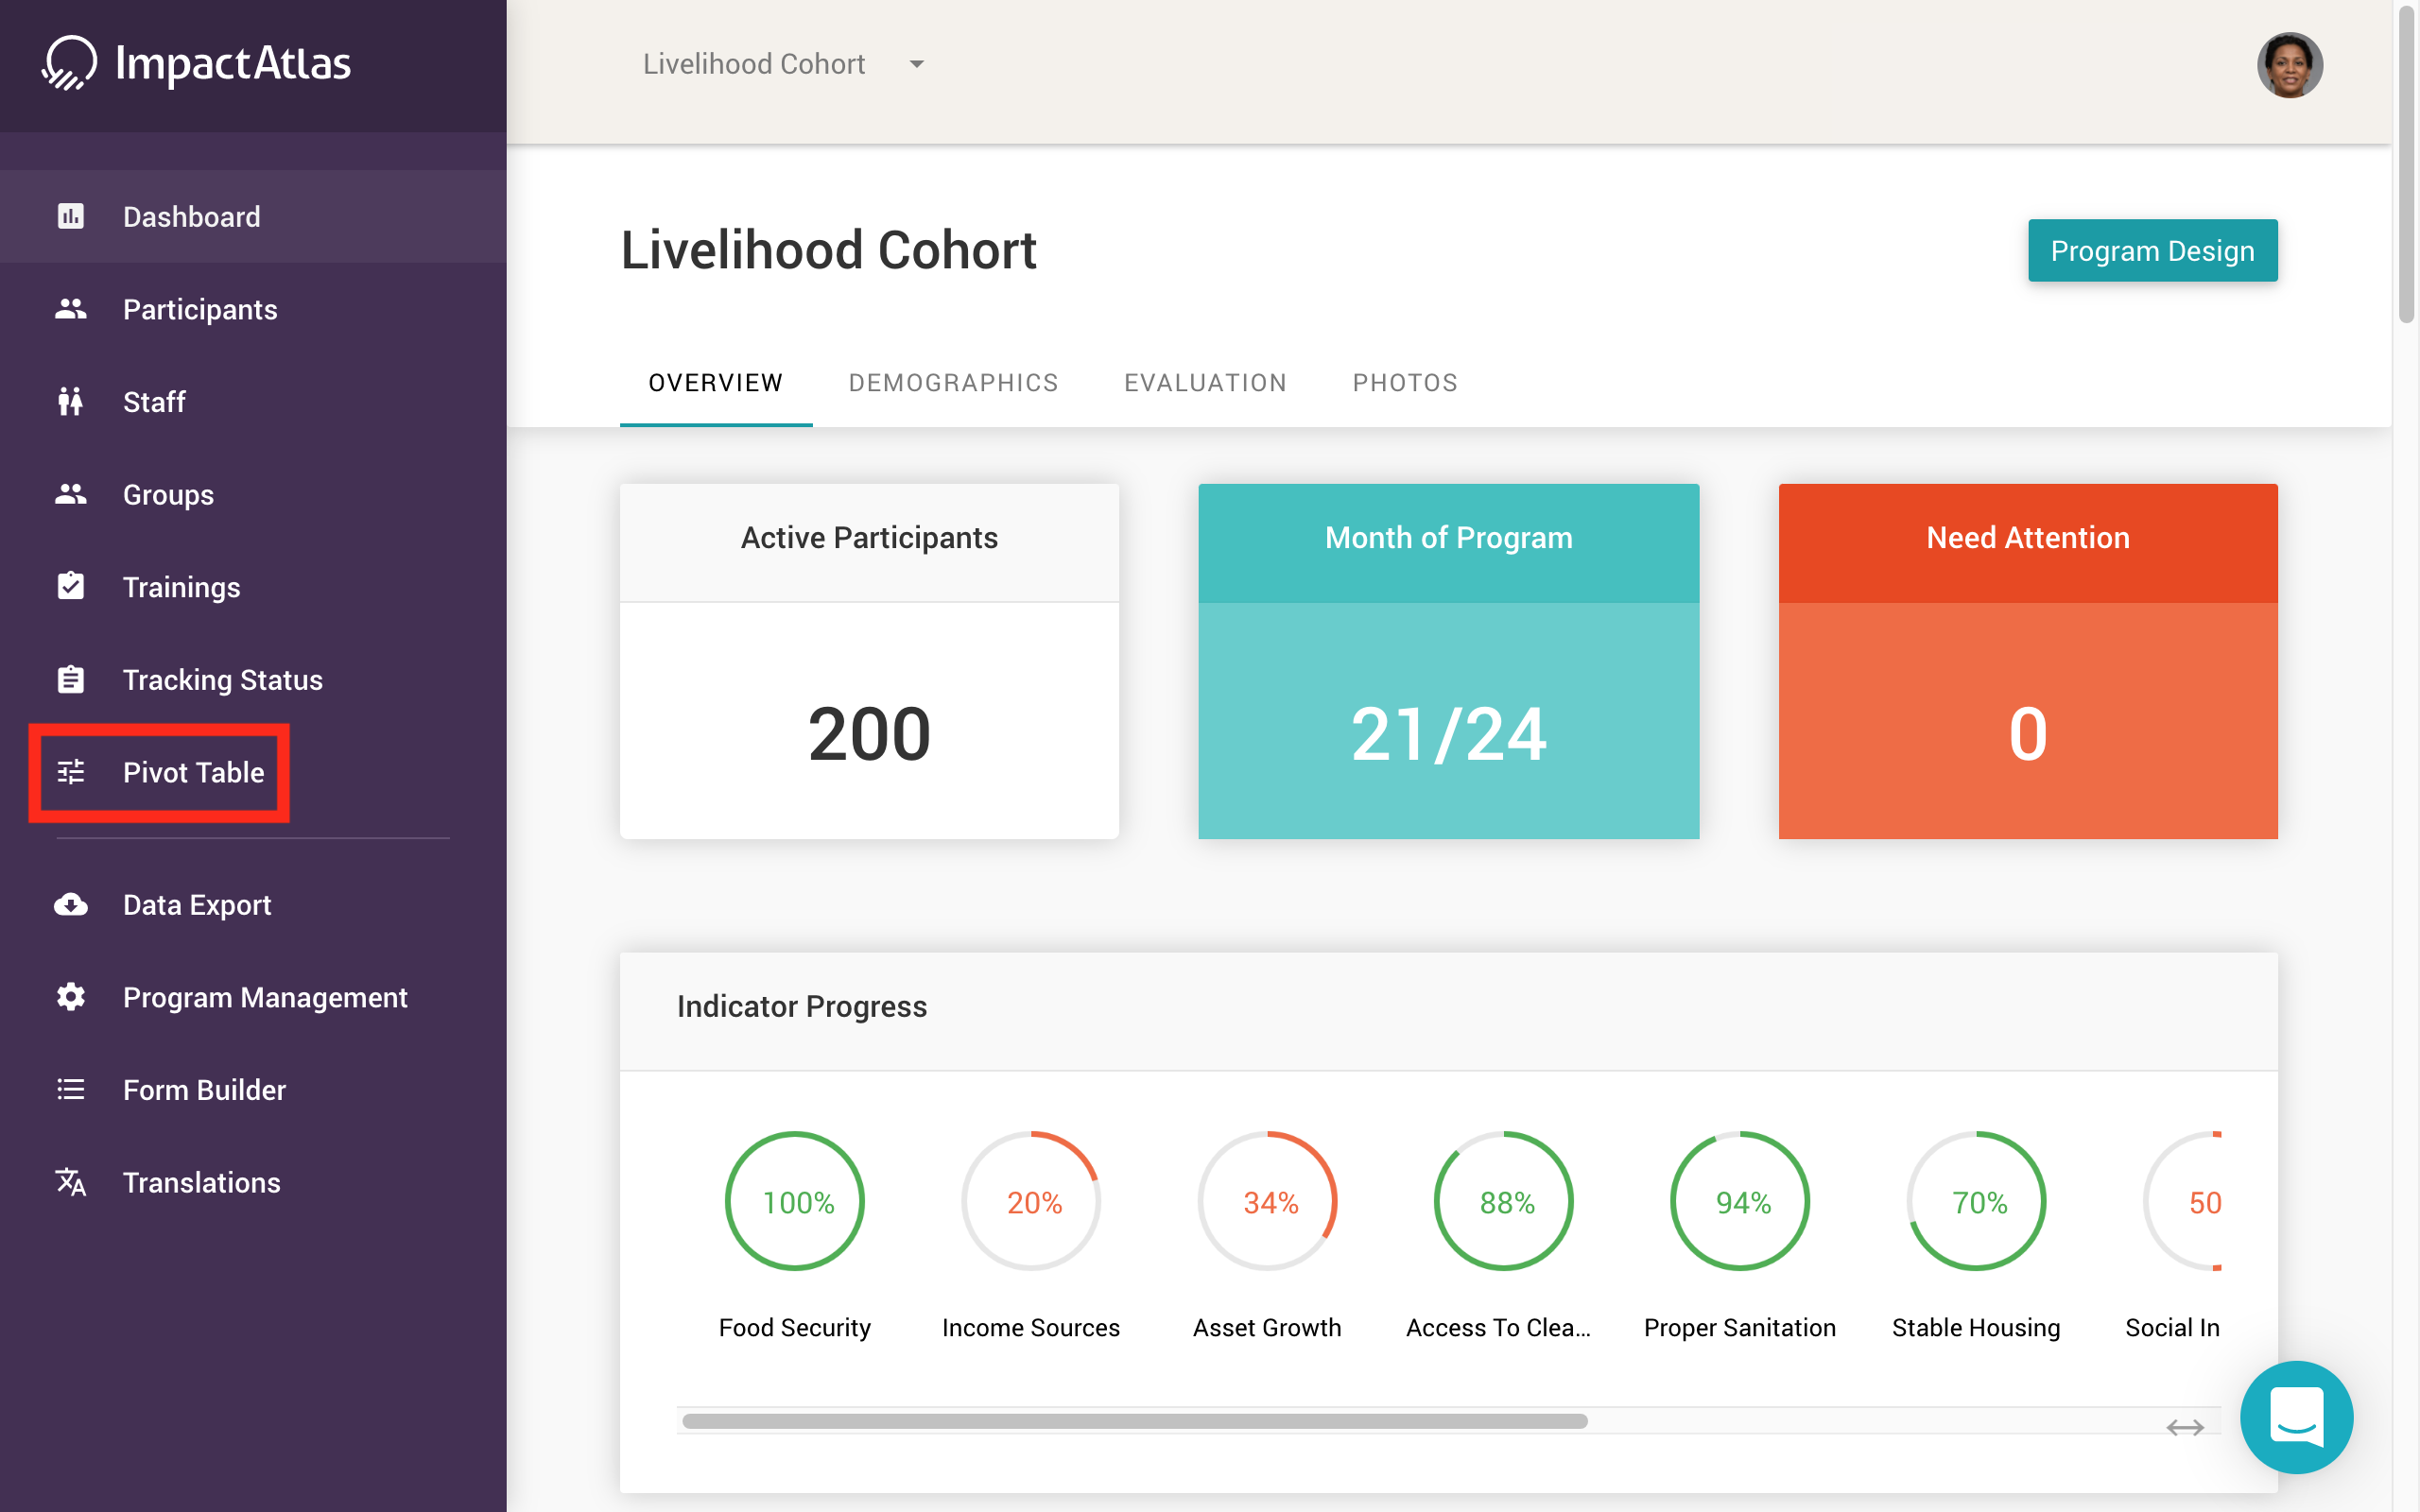
You can create visuals for completed surveys. Begin by click on the Pivot Table tab on the left navigation panel.
.png)
Next, follow the video below for detailed instructions on how to visualize your data in different ways and then export what you create.
You can create visuals for completed surveys. Begin by click on the Pivot Table tab on the left navigation panel.
Next, follow the video below for detailed instructions on how to visualize your data in different ways and then export what you create.